Mapping_Earthquakes
Background
Basil and Sadhana like how I created my earthquake map with two different maps and the earthquake overlay. Now, Basil and Sadhana would like to see the earthquake data in relation to the tectonic plates’ location on the earth, and they would like to see all the earthquakes with a magnitude greater than 4.5 on the map, and they would like to see the data on a third map.
Deliverable 1: Add Tectonic Plate Data
Using your knowledge of JavaScript, Leaflet.js, and geoJSON data, I’ll add tectonic plate data using d3.json(), add the data using the geoJSON() layer, set the tectonic plate LineString data to stand out on the map, and add the tectonic plate data to the overlay object with the earthquake data.
Follow the instructions below and the numbered comments in the starter code to complete Deliverable 1.
-
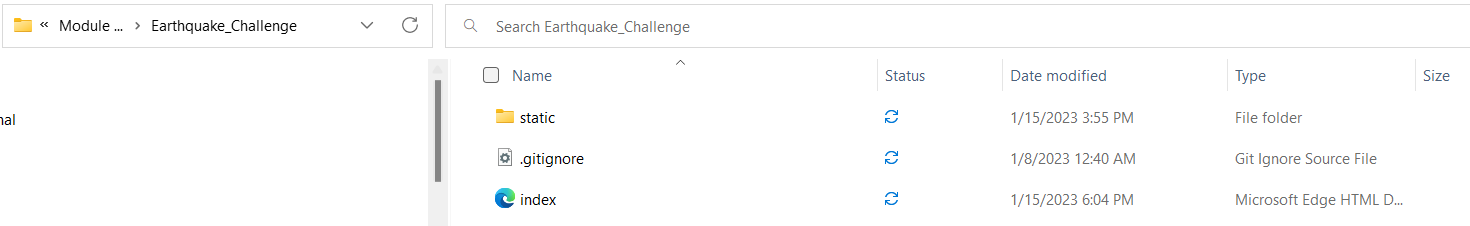
Create a new folder on my Mapping_Earthquakes repository and name it “Earthquake_Challenge.”
-
Copy the folders and files from your Earthquakes_past7days branch and add them to the Earthquake_Challenge folder. The folder should have this structure:
- Earthquake_Challenge folder
index.html- static
- css
style.css
- js
config.jslogic.js
- css
- Earthquake_Challenge folder
-
Download the
tectonic_plate_starter_logic.jsfile, add it to your js folder, and rename itchallenge_logic.js.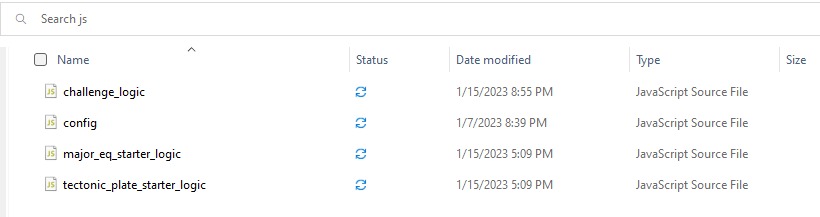
-
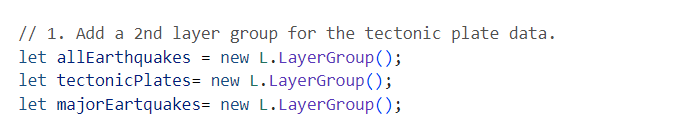
In Step 1, add a second layer group variable for the tectonic plate data.
-
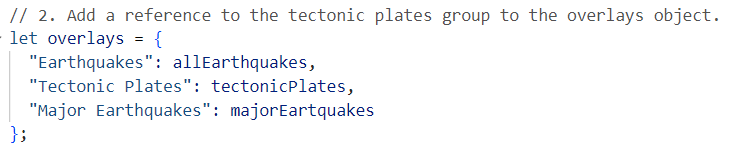
In Step 2, add a reference to the tectonic plate data to the overlay object.
-
In Step 3, using
d3.json()callback method, make a call to the tectonic plate data using theGeoJSON/PB2002_boundaries.jsondata from this GitHub repository links to an external site.for the tectonic plate data. I’ll need to log into GitHub to access the GeoJSON data.
-
Inside the
d3.json()method do the following:- Pass the tectonic plate data to the
geoJSON()layer. - Style the lines with a color and weight that will make it stand out on all maps.
- Add the tectonic layer group variable you created in Step 1 to the map, i.e.,
.addTo(tectonicPlates)and close thegeoJSON()layer. - Next, add the tectonic layer group variable to the map, i.e,
tectonicPlates.addTo(map). - Finally, close the
d3.json()callback.
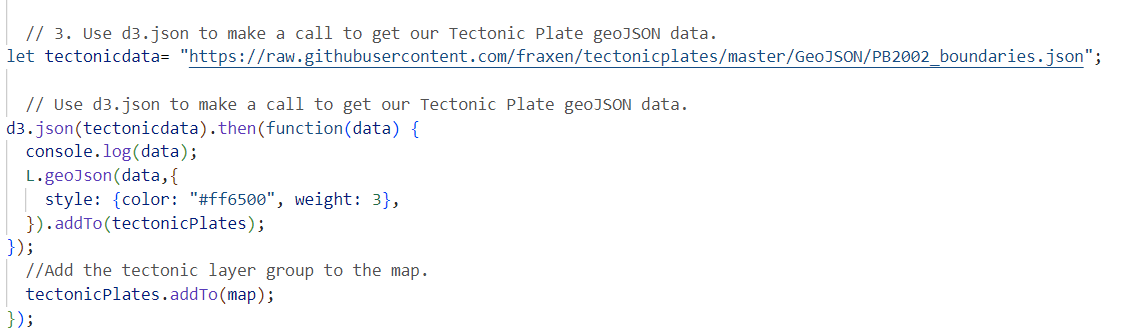
- Pass the tectonic plate data to the
-
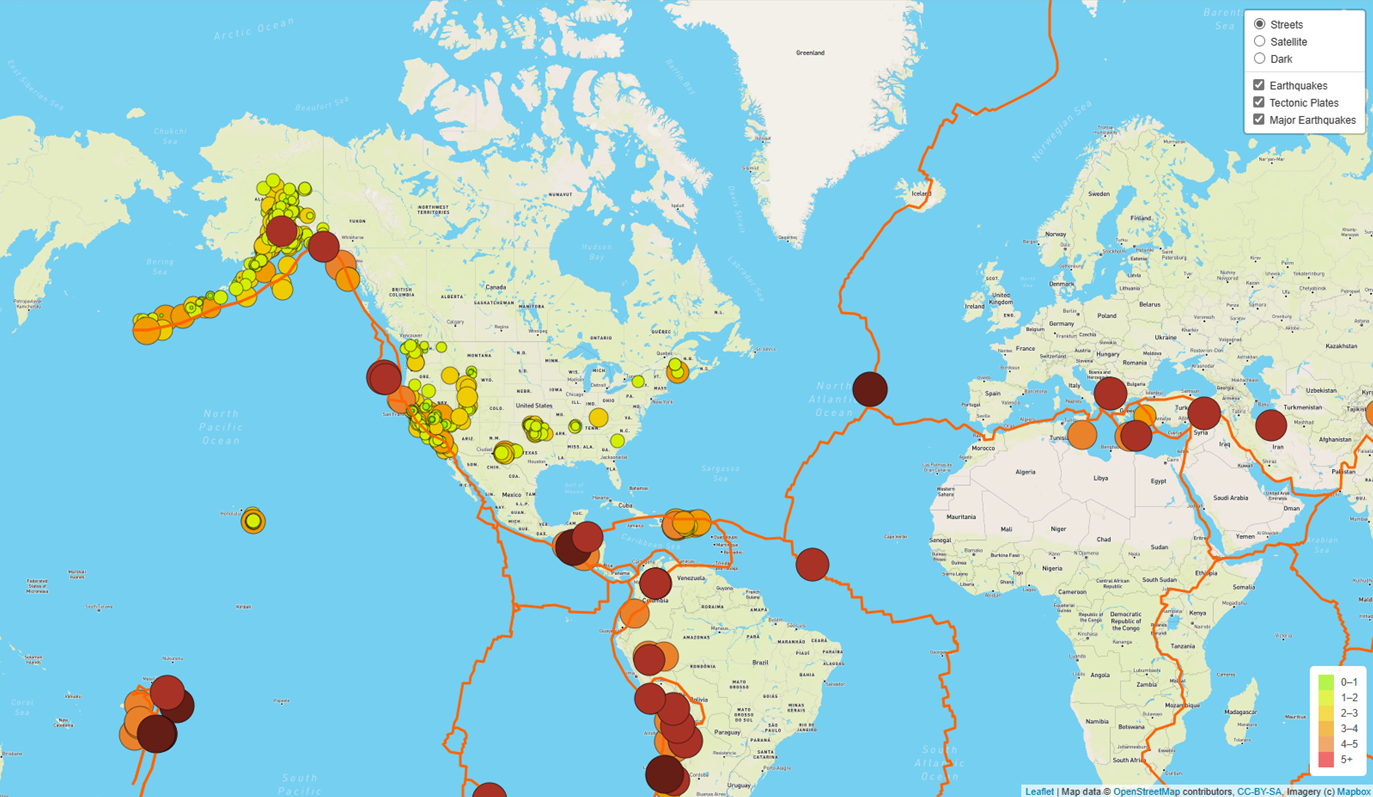
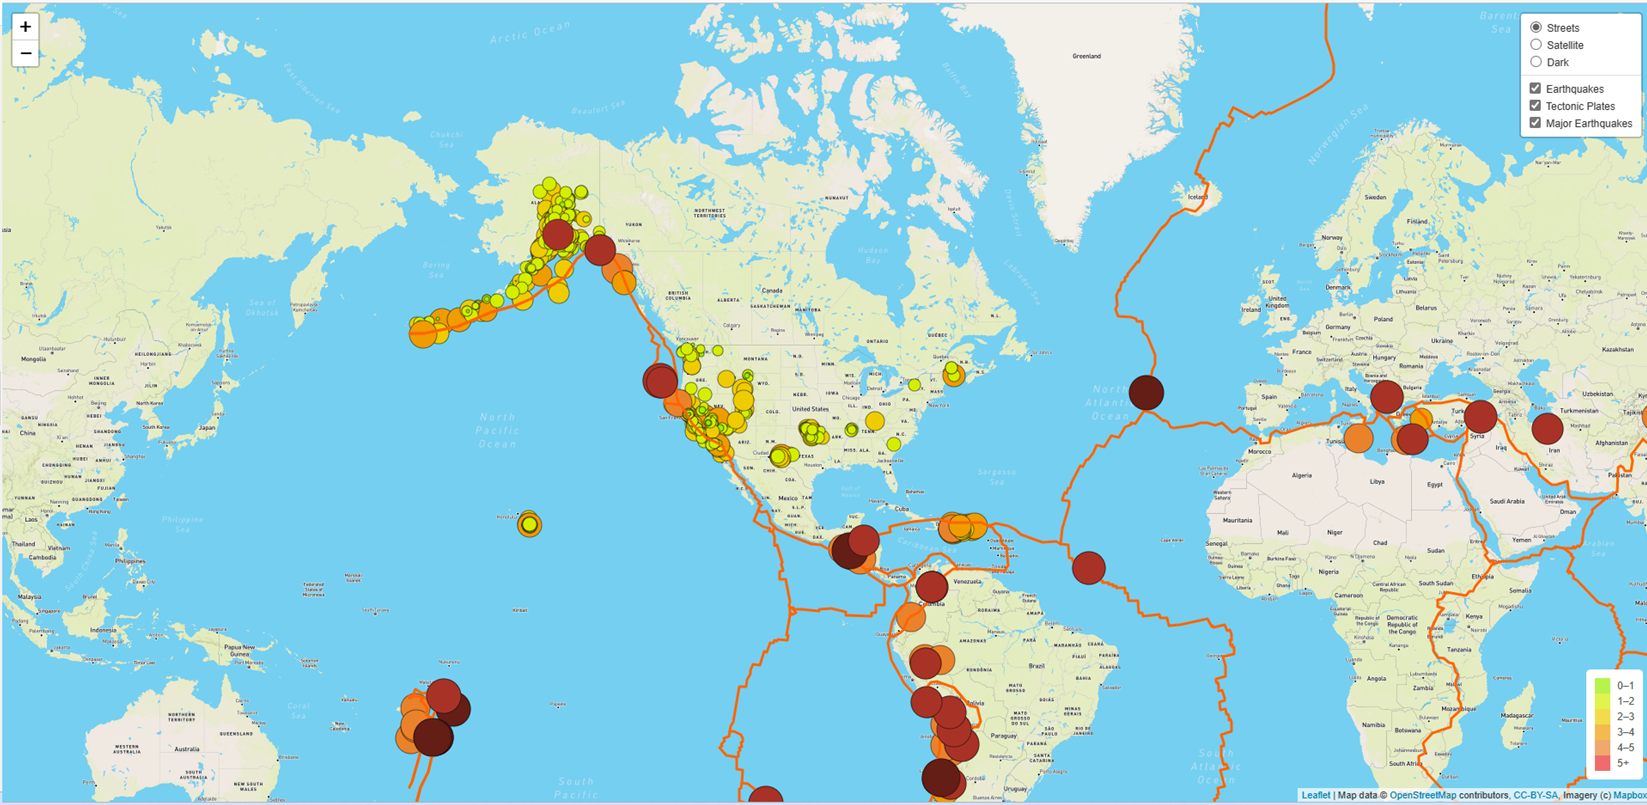
Start your Python server and launch the
index.htmlfile and confirm that my map with the earthquake and tectonic plate data is similar to the following image.
My final map looks similar to the image provide on the Module Challenge:
Deliverable 2: Add Major Earthquake Data
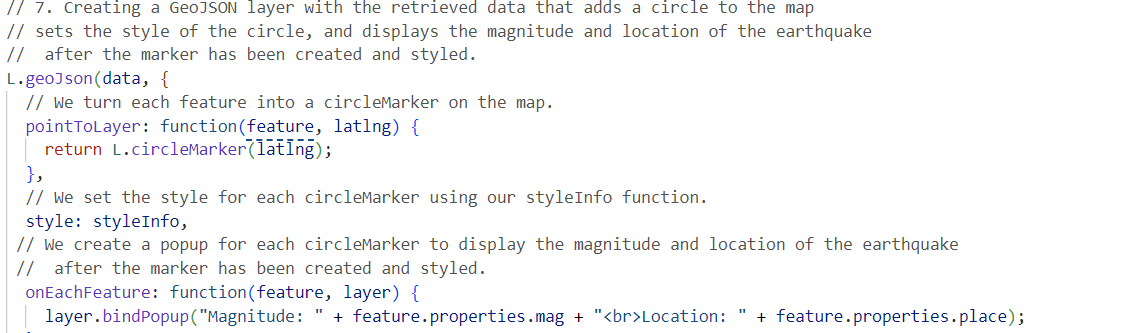
Using my knowledge of JavaScript, Leaflet.js, and geoJSON data, I’ll add major earthquake data to the map using d3.json(). I’ll also add color and set the radius of the circle markers based on the magnitude of earthquake, and add a popup marker for each earthquake that displays the magnitude and location of the earthquake using the GeoJSON layer, geoJSON().
Download the major_eq_starter_logic.js file and add it to my js folder. Look over the starter code and use it as a template to modify your challenge_logic.js file that you used to add the tectonic plate data in Deliverable 1.
Follow the instructions below that refer to the steps in the major_eq_starter_logic.js file and make the changes to my challenge_logic.js file to complete Deliverable 2.
- In Step 1, add a third layer group variable for the major earthquake data.
-
In Step 2, add a reference to the major earthquake data to the overlay object.
-
In Step 3, use the
d3.json()callback method to make a call to the major earthquake data from the GeoJSON Summary Feed for M4.5+ Earthquakes Links to an external site.for the Past 7 Days.

-
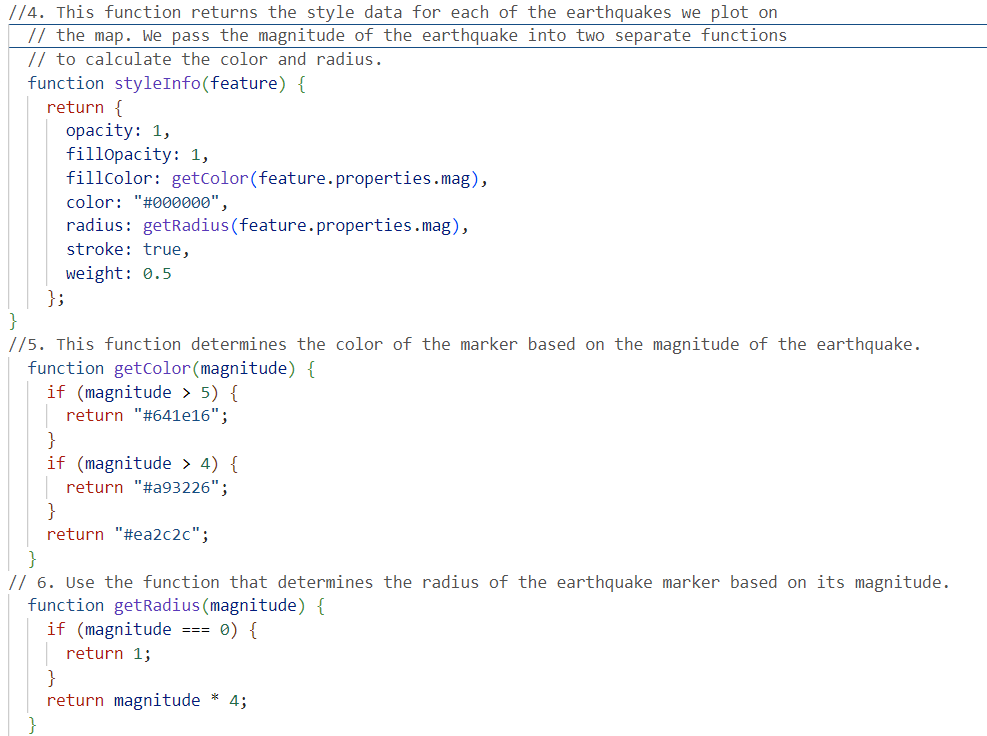
In Step 4, use the same parameters in the
styleInfo()function that will make a call to thegetColor()andgetRadius()functions. -
In Step 5, change the
getColor() function to use only three colors for the following magnitudes; magnitude less than 5, a magnitude greater than 5, and a magnitude greater than 6. -
In Step 6, use the same parameters from the preceding step in the
getRadius()function.
- In Step 7, pass the major earthquake data into the GeoJSON layer and do the following with the
geoJSON()layer: - Turn each feature into a circleMarker on the map - Style each circle with styleInfo() function - Create a popup for the circle to display the magnitude and location of the earthquake - Add the major earthquake layer group variable you created in Step 1 to the map, i.e.,.addTo(majorEQ)and then close thegeoJSON()layer.
-
Then, add the major earthquake layer group variable to the map, i.e,
majorEQ.addTo(map), and then close thed3.json()callback. -
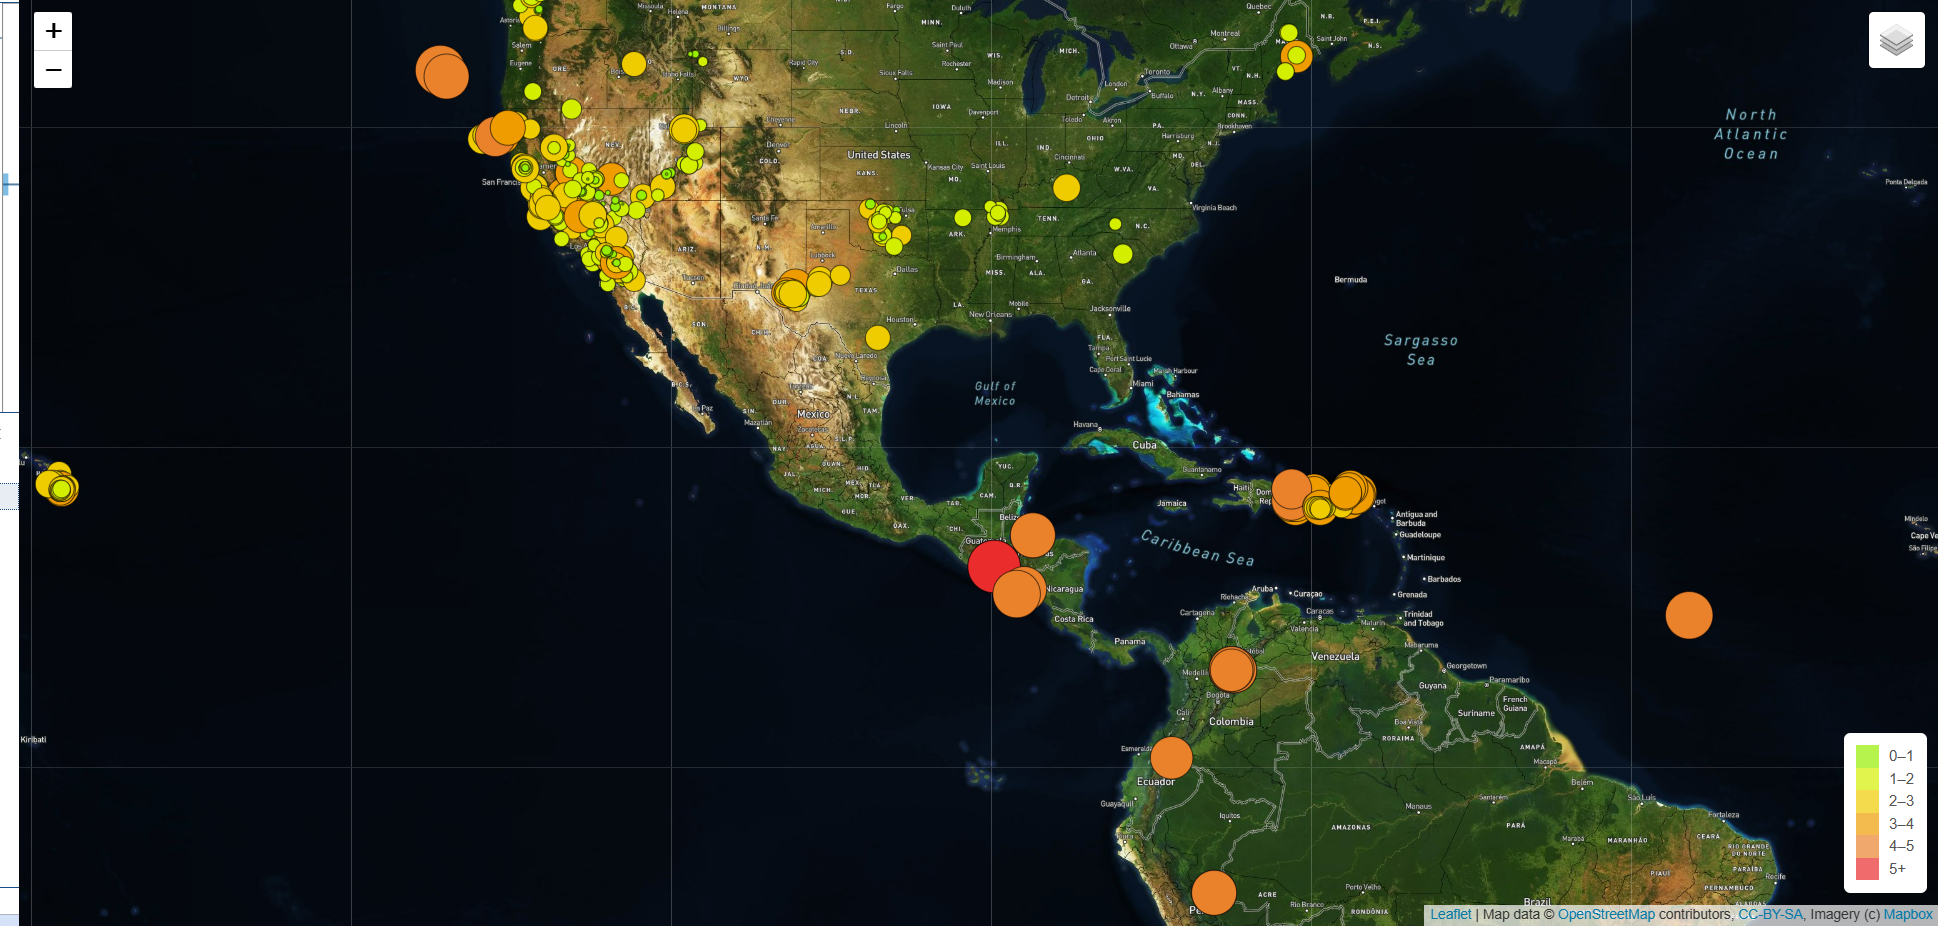
Start my Python server and launch the index.html file and confirm that my map with the two earthquake data sets and tectonic plate data is similar to the image on the challenge.
Deliverable 3: Add an Additional Map
Using your knowledge of JavaScript and Leaflet.js add a third map style to your earthquake map.
-
Using the options from the Mapbox styles Links to an external site., add a third map style as a tile layer object to the
challenge_logic.jsfile. -
Add the map variable to the base layer object.
-
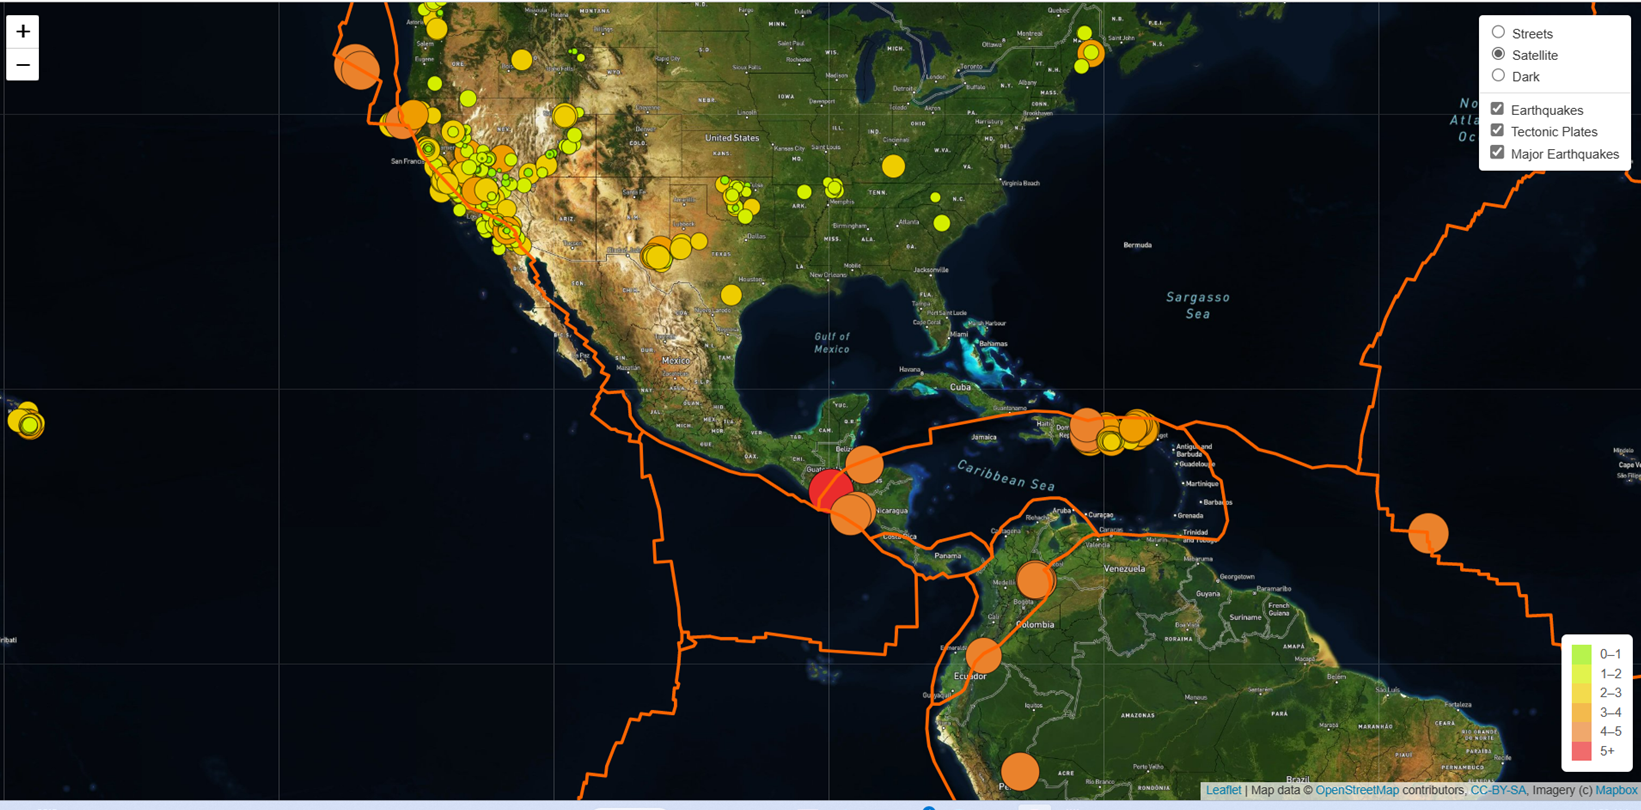
Start my Python server and launch the index.html file and confirm that your map is similar to the following image, where there are three map styles, and displays the two earthquake data sets and the tectonic plate data.
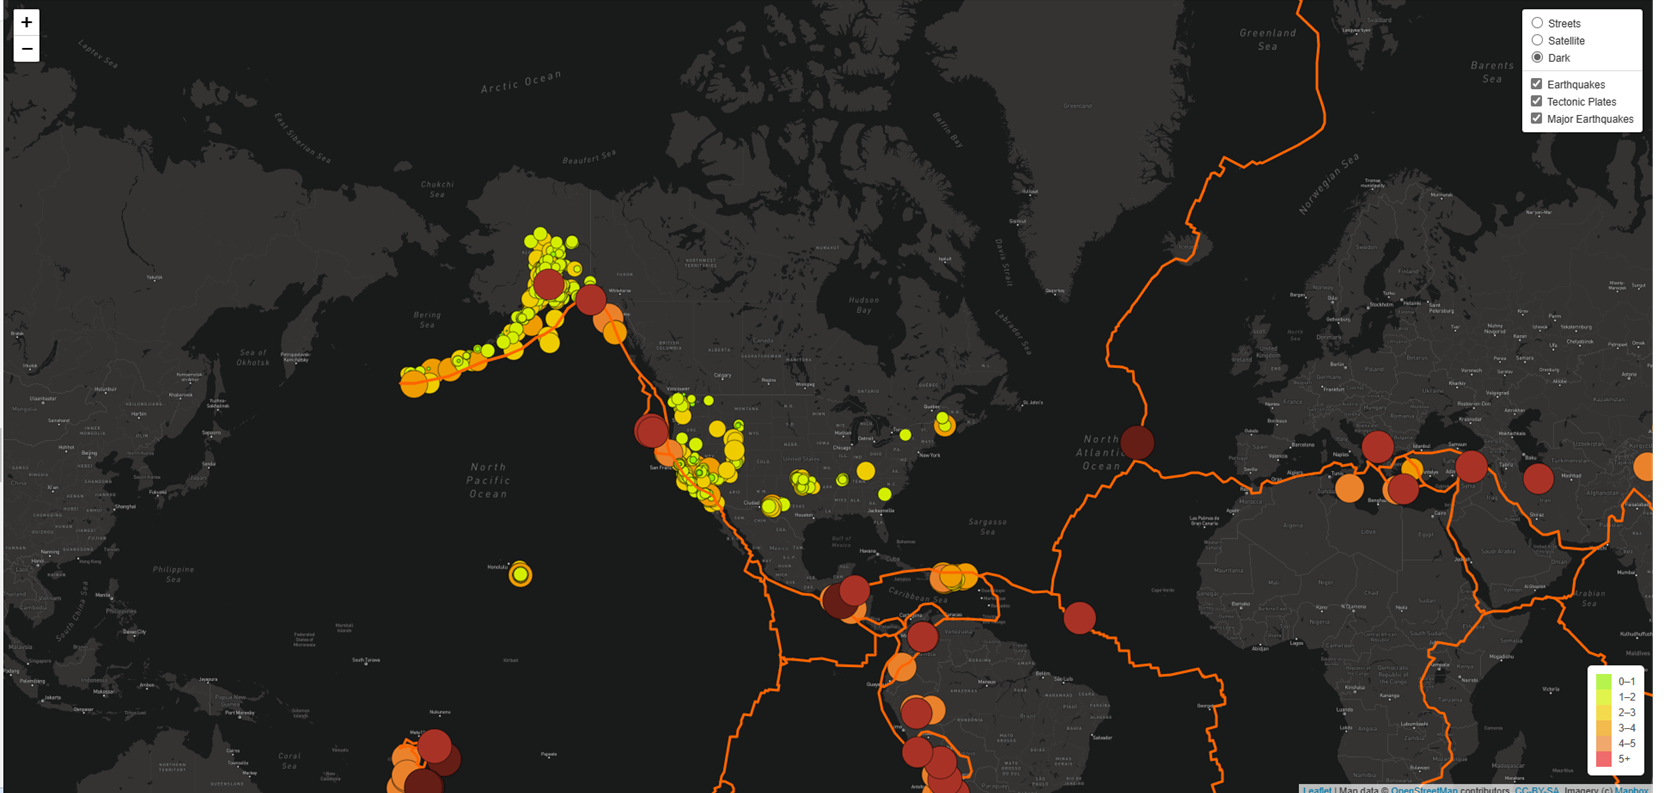
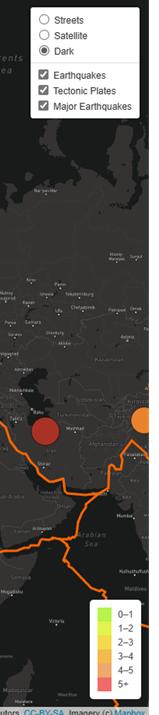
The legend showing on below screentshoot:
Sources:
https://www.mapbox.com/
https://github.com/fraxen/tectonicplates
https://earthquake.usgs.gov/earthquakes/feed/v1.0/summary/4.5_week.geojson
JavaScript, Leaflet.js, and geoJSON data
Module 14 Challenge
By Marisol Gascon Linarez
UCF Bootcamp Data Visualization and Analytics
Link to my github page https://gasconma1960.github.io/Mapping_Earthquakes/